


Dynamic scenario planning is useful when trying to understand complex systems like the economy, especially under stress. With oil prices moving sharply, I am releasing one of my internal tools: an interactive simulator for oil-price shocks.
The tool starts from current WTI levels and lets users test both live scenarios and historical analogs. Adjust peak oil prices and shock duration, and the model projects the resulting paths for gasoline prices, GDP growth, unemployment, and inflation over a four-year horizon.
Premium subscribers can find it here. Here is what it looks like:
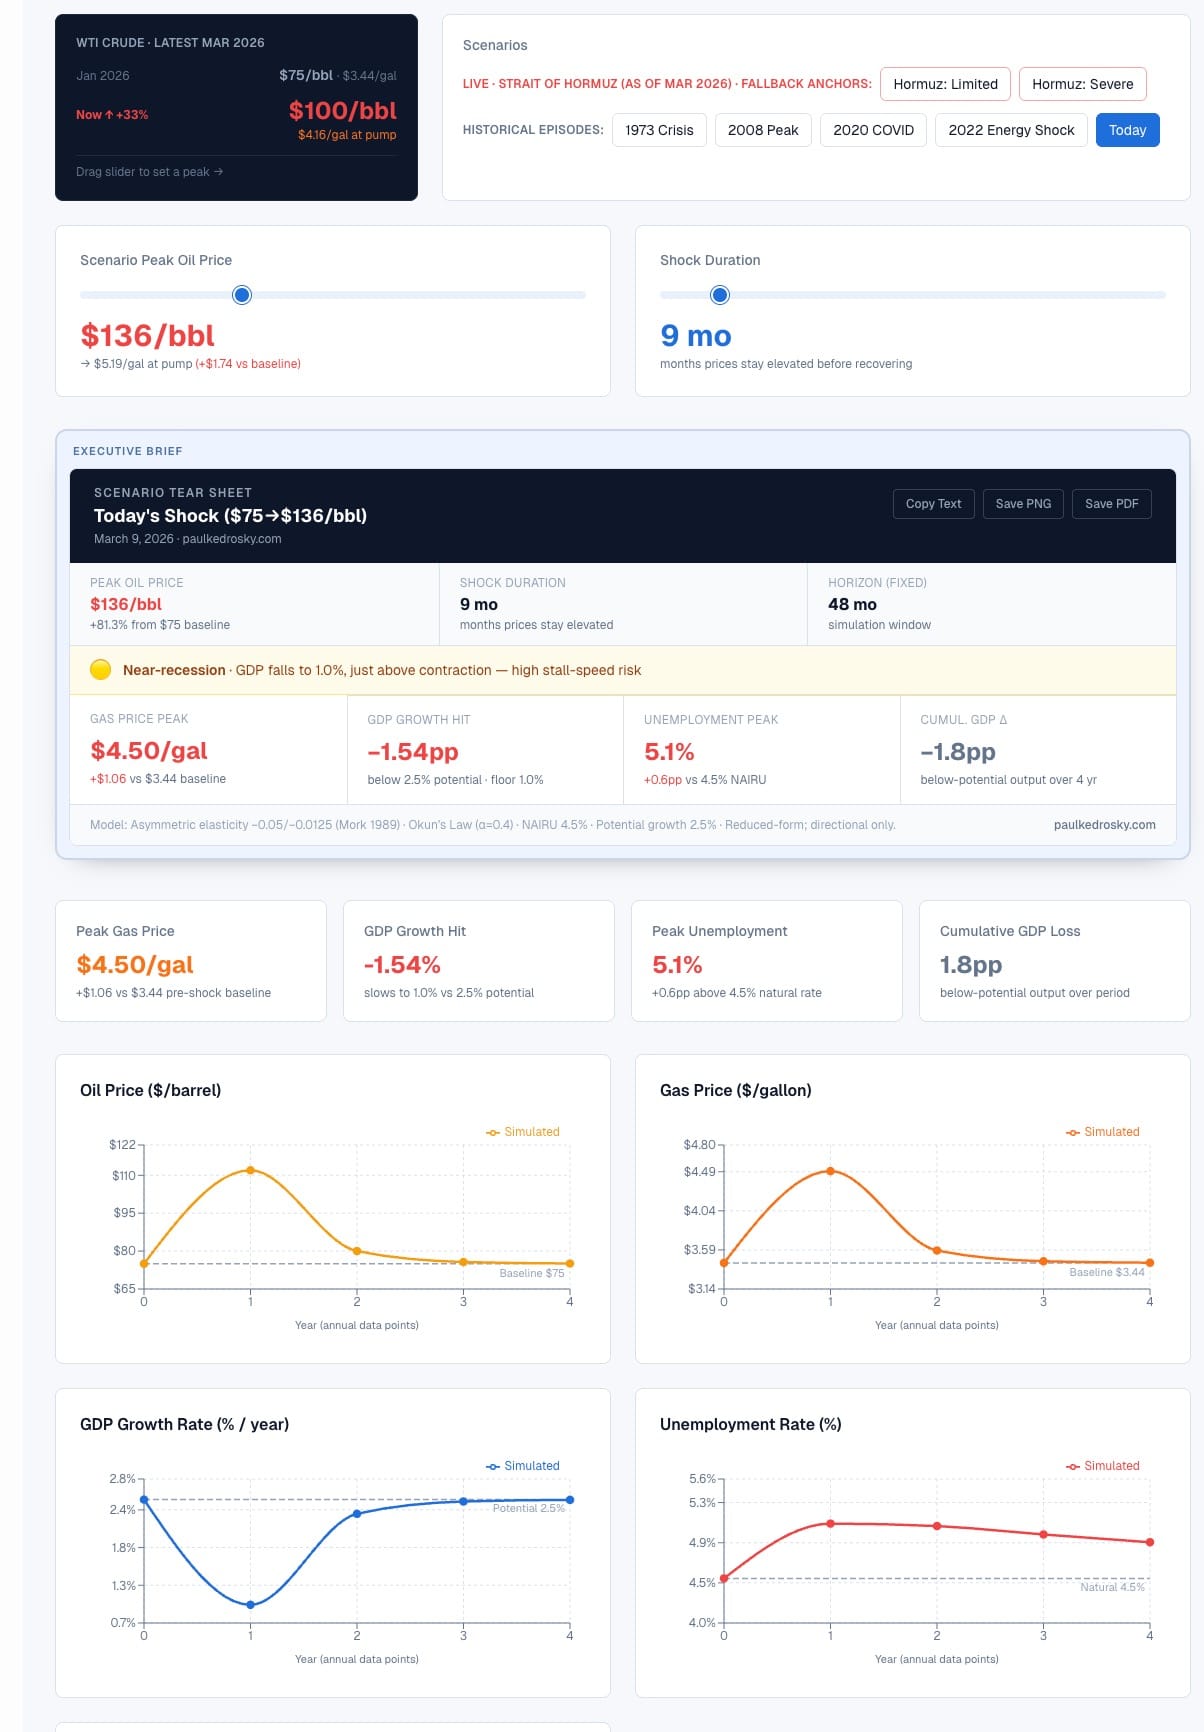
The goal is clarity rather than precise forecasting. The model is intentionally reduced-form, designed to provide quick directional insight during energy shocks.
Users can select preset scenarios or build their own, then immediately compare outcomes. A structured tear sheet summarizes each scenario in plain language, highlighting headline metrics and flagging when the shock implies elevated recession risk.
Under the hood, the simulator combines empirical oil-to-gas pass-through, asymmetric growth sensitivity to energy shocks, labor-market response dynamics, and a simple inflation proxy. The result is a compact view of how energy shocks propagate through consumer prices and the real economy.
Premium subscribers can try it here.
Don't forget about about Chartbook Live, which I launched last week for Premium subscribers.