

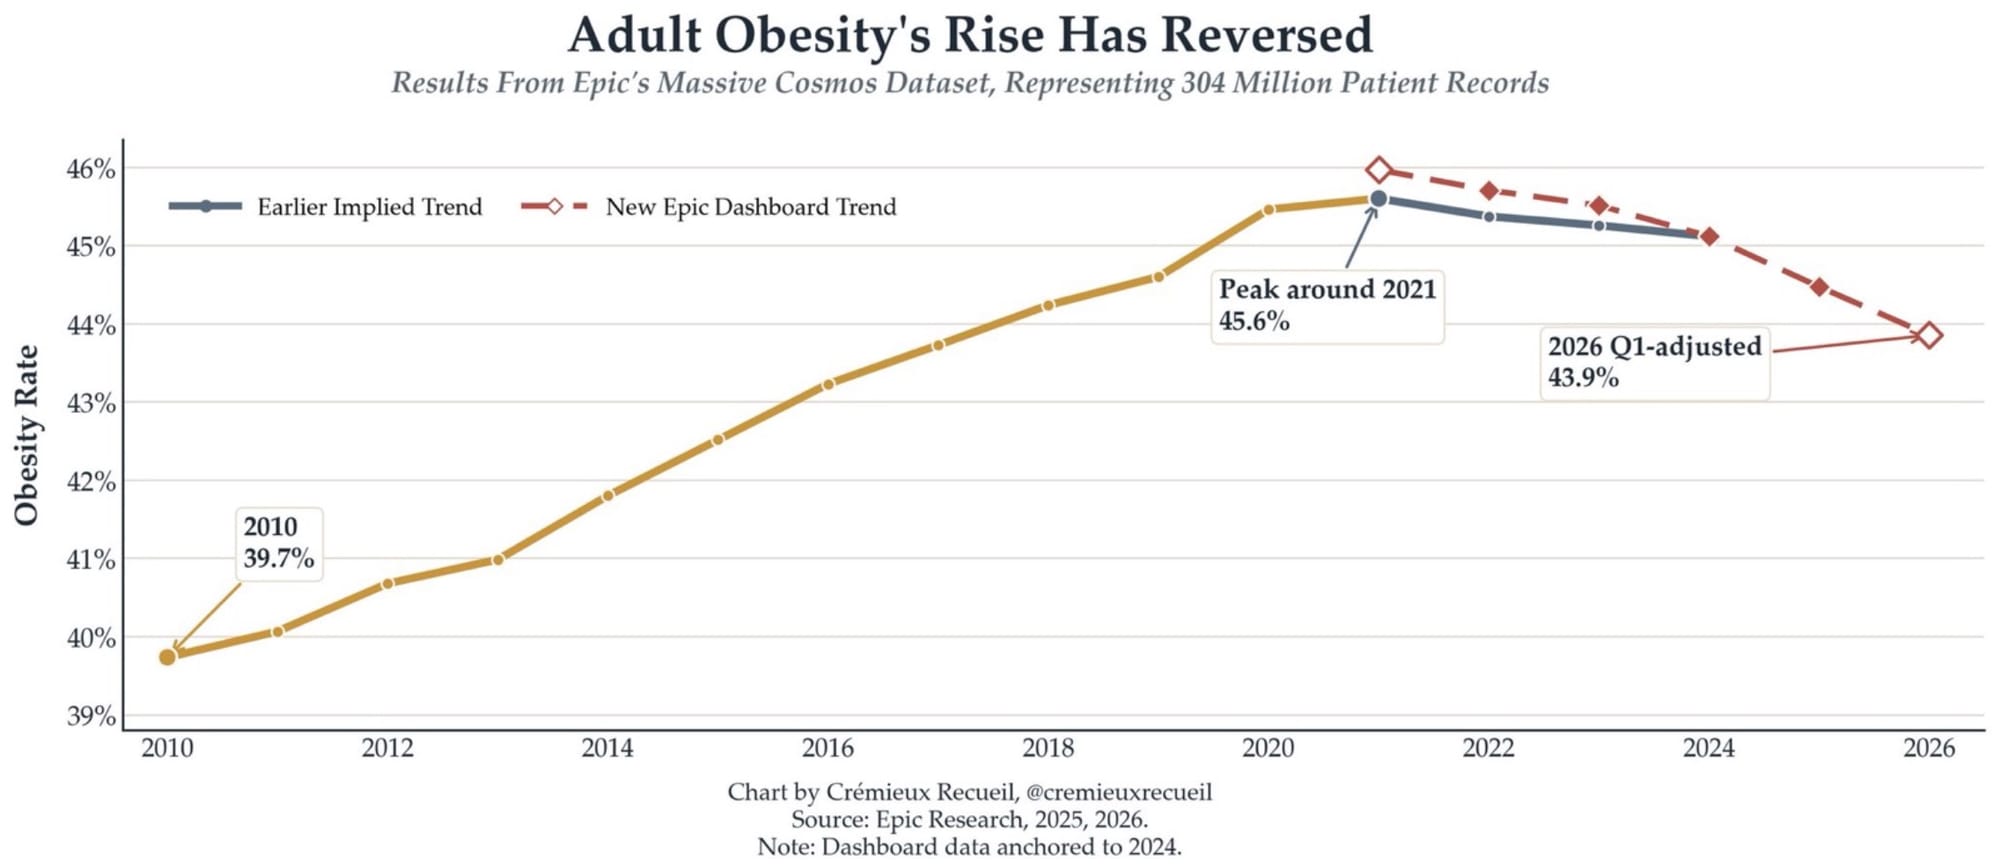
As much as I want to dismiss the following U.S. obesity chart on technical grounds—truncated y axis, massive effect size claimed in a short time, and skewed sampling—it is hard not to think there is a there, given the huge Epic data set. It shows that the US has likely passed peak obesity, and, largely under the pressure of GLP-1s, is on a downward trajectory.
Many people have discussed the obvious consequences, so here are some less expected ones to consider:
- Commercial real estate further weakens
- Fewer obesity-driven healthcare facilities required
- Suburban medical-office demand growth slows materially
- Airline economics subtly improve
- Average passenger weight declines reduce fuel consumption
- Aircraft range and payload efficiency improve marginally
- Dating and fertility dynamics shift
- Fertility rates may rise modestly among older adults
- Appearance competition intensifies across middle-aged populations
- Longevity inequality compounds across generations
- Wealthy populations accumulate health, energy, and attractiveness advantages simultaneously
- Biological aging increasingly becomes economically stratified